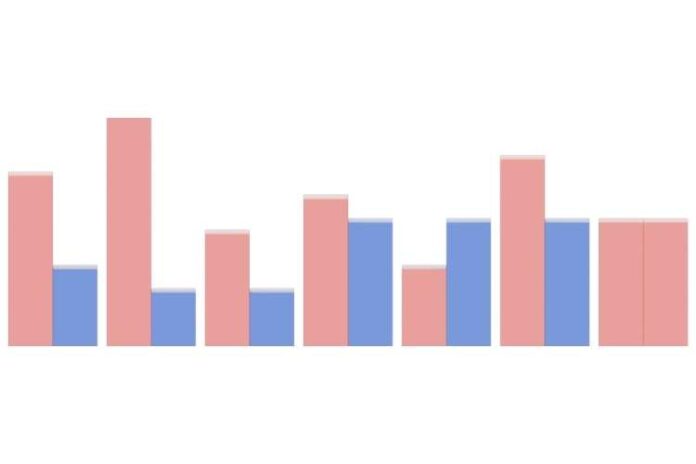
Today’s world is becoming increasingly information-centric. Every aspect of our lives makes use of data in some way. The tabular representation of data is an excellent method for presenting it in a systematic manner. When numerical figures are represented graphically in the form of a bar graph or a line graph, they become more visible as well as understandable, leaving a long-lasting impression on the observer’s mind. Let’s discuss what line graphs are and what are the advantages as well as disadvantages of line graphs.
What is a Line Graph?
A line graph is a graphical representation of the changes that have occurred over a specific time period. A line graph has an x-axis that runs horizontally and a y-axis that runs vertically. The x-axis usually has a time period that we want to measure the quantity of a specific thing or item in the y-axis.
A line graph can be used to analyse whether the quantity on the y-axis is increasing or decreasing over time. A line graph clearly depicts an increasing or decreasing trend.
How Do You Plot a Line Graph?
Making a line graph is simple. Here are some simple steps to follow when creating a line graph.
- On graph paper, draw the x- and y-axes. Make sure to write the title above the table so that it is clear what the graph is for.
- For example, if one of the factors is time, it is plotted on the horizontal axis, also known as the x-axis. The other factor would then be placed on the vertical axis, known as the y-axis. Label both axes according to their respective factors. We can, for example, label the x-axis as time or day.
- Then, using the previously provided data, highlight the exact values on the graph. Once the points are joined, you can draw a clear conclusion about the trend.
Benefits of a Line Graph
The following are the benefits of using a line graph.
- It is useful for displaying changes and trends over various time periods.
- It is also useful for displaying small changes that are difficult to quantify in other graphs.
- Because they are simple, easy to understand, and efficient, line graphs are popular and effective charts.
- It is useful for highlighting anomalies within and between data series.
- As a form of comparison, more than one line may be plotted on the same axis.
Disadvantages of Line Graph
Here are some of the drawbacks of using a line graph.
- When there are too many lines on the graph, it becomes cluttered and difficult to read.
- A wide range of data is difficult to plot on a line graph.
- They are only appropriate for representing data with numerical values and total figures, such as total rainfall in a month.
- If consistent scales on the axis are not used, the data in a line graph may appear inaccurate.
- In addition, line graphs are inconvenient when plotting fractions or decimal numbers.
If you want to know more about the topic, you can visit the Cuemath website.
Scatter Plot
Scatter Plots are regarded as one of the most useful statistical graph inventions. The scatter plot was first presented by an English scientist, John Frederick W. Herschel, in 1833. Herschel used it to study the orbits of double stars. He plotted the double star’s positional angle in relation to the year of measurement.
The scatter plot was used to determine the basic relationship between the two measurements. Despite the popularity of bar charts and line plots, the scatter plot continues to reign supreme in the scientific and business worlds. It is very simple for people to understand the relationship between points on a scale.
A scatter plot analysis can help us understand the following aspects of the data.
- The various levels of correlation among the data points help to understand the relationship within the data.
- For the given data, a line of best fit can be drawn and used to predict new data values.
- Outliers can be easily identified by identifying data points that fall outside of the given set of data.
- A scatter plot’s grouping of data points can be identified as different clusters within the data.


